

Ethereum surpasses 2,300 USDT: key indicators and technical analysis
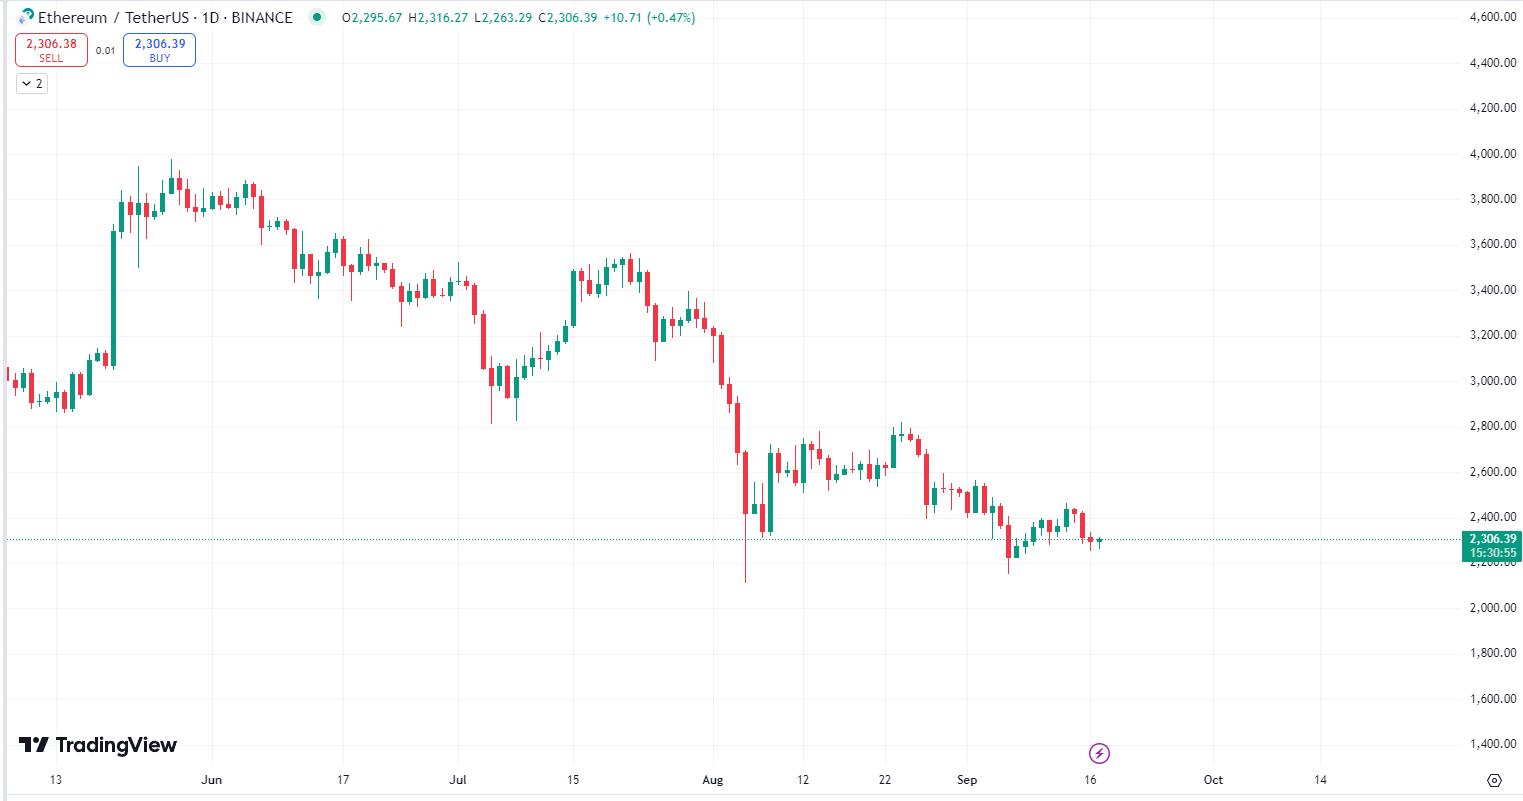
On September 17, 2024, according to Binance Market Data, the price of Ethereum (ETH) exceeded 2,300 USDT and currently stands at 2,309.5 USDT. Despite this increase, ETH showed a decline of 0.28% over the past 24 hours.
Price movement
Ethereum (ETH) has seen significant fluctuations in recent weeks, trading in a range from$1,500 to $2,000due to macroeconomic factors and crypto market sentiment. At the time of analysis, ETH/USDT is trading in the range of$1,650-$1,700.
- Key levels of support:
- $1,500: Strong psychological and historical support level. The price bounced from this zone several times.
- $1,620: Recent short-term support level based on consolidation.
- Key resistance levels:
- $1,750: The nearest resistance zone, the price tested this level several times, but could not break through it.
- $1,850: Next important level if the price breaks $1,750.
- $2,000: Psychological and key resistance level, a breakout of which could trigger significant buying.
2. Candlestick patterns
- Current Patterns: Daily candles are forming a possible bearish hold at $1,720, indicating the possibility of a short-term reversal. There has been some selling pressure in the market over the last few trading days.
- Moving average crossovers:
- 50-day moving average (MA): ETH is trading around this level, which serves as an immediate resistance zone.
- 200-day moving average (MA): The long-term moving average is near $1,800, which suggests that if the 50-day MA is broken, Ethereum could rush towards the $1,800 level.
Indicators
- Relative Strength Index (RSI):
- RSI is around 45-50, which suggests that ETH/USDT is now in the neutral zone. It is not overbought, which leaves room for further decline, but it is not oversold either, which can lead to growth if purchase volumes increase.
- MACD (Moving Average Convergence/Divergence):
- On the daily chart, the MACD is showing a slight bearish trend as the signal line has crossed the MACD line from above, which may indicate a possible decline. However, the histogram shows weakening bearish momentum, which may indicate a bottom is approaching.
- Bollinger Bands:
- ETH/USDT is trading near the lower Bollinger band, which signals that the price may be oversold and a bounce is possible in the short term.
Trade volumes
Trading volumes have been relatively low in the last few days, indicating uncertainty in the market. Low volumes can also indicate that a big move may be coming soon. A breakout of the current range ($1,620-$1,750) could lead to significant price moves depending on whether volume confirms the breakout.
Bullish scenario
- If Ethereum holds support at $1,620, a rise towards the resistance level of $1,750 is possible. A breakout of this level, confirmed by volumes, could take ETH/USDT to $1,850and potentially to $2,000in the medium term.
- RSI in the neutral zone allows Ethereum to gain momentum without quickly reaching the overbought zone.
Bearish scenario
- If ETH fails to hold at $1,620, then a retest of the $1,500 level could occur, which will become an important area for further decline. If this level is broken, the next target will be $1,400.
- A bearish MACD crossover indicates short-term weakness, and if confirmed by lower prices, further downward momentum is possible.
Conclusion and forecast
- Short-term (1 week):Bearish or neutral scenario with downside risk if $1,620 is broken.
- Medium term (1-4 weeks): Bullish scenario with a breakdown of the $1,750 level and movement to $1,850.
- Long-term (3 months or more): Bullish scenario with improvement in the macroeconomic situation and sentiment in the crypto market. A breakout of $2,000 could open the way to $2,500.
This material is intended for informational purposes only and does not constitute an individual investment recommendation!