TradingView full review: How to use the platform and how to configure it correctly
Article updated: 03/12/2025
TradingView is one of the most popular platforms for technical analysis and trading in the financial markets. It provides many tools for analyzing charts, creating trading strategies, and sharing ideas with other traders. In this article we will look at how to use TradingView, how to configure it correctly for trading and other issues regarding the operation of the platform.
How to use TradingView
In this section, we will analyze in detail how to use TradingView for free, consider the main functions of the trading terminal and give step-by-step instructions on how to use them, so that you can make the most of all the capabilities of this platform.
TradingView versions and use cases
TradingView can be used either directly in a web browser or in a separate Windows application. Both versions of the platform are synchronized with each other, allowing users to seamlessly switch between devices and continue working where they left off.
Three options for using the TradingView service:
- Simplified version:No registration and limited functionality;
- Free version: You can save charts and add trading pairs to your favorites. There are restrictions on the number of indicators used, the list of favorites, opening only one chart at a time, and so on;
- Full paid version: All functionality of the platform is available with different limits, depending on the subscription level.
TradingView supports multiple languages, allowing you to use it from anywhere in the world. We recommend registering on the platform to use more features of the service.
Registration and account creation
The first correct step in using TradingView is to register and create an account. This can be done on the official website of the platform. Registration is free and only takes a few minutes. Having an account will allow you to access all functions of the platform, save chart settings, set notifications and share your ideas with the community of traders and analysts.
Steps to register:
- Go to official website TradingView.
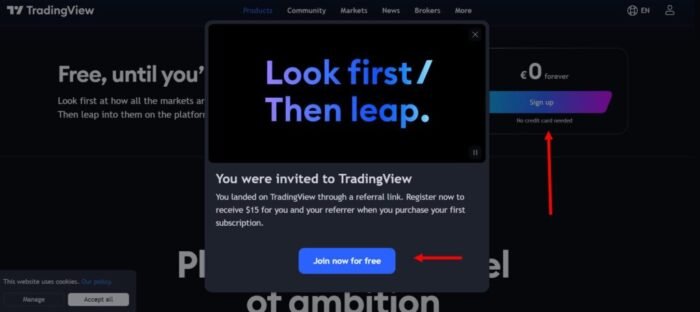
- Click on the “Register” button (Join now for free or Sign up).
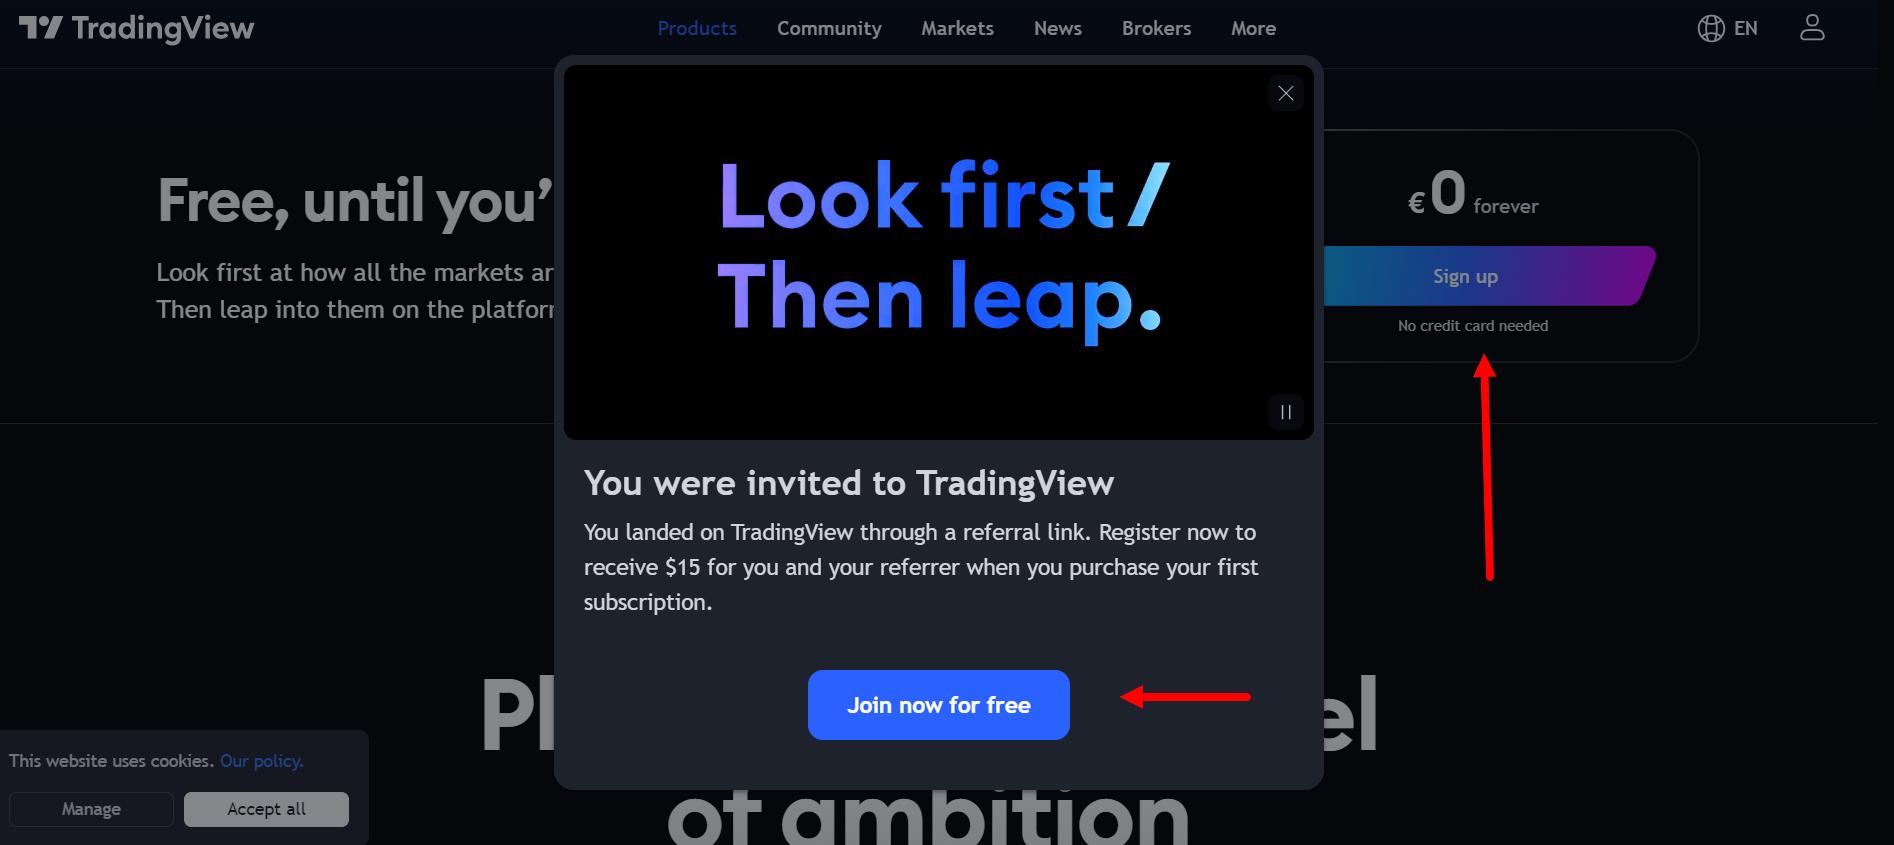
- Choose a registration method: via email, social networks or Apple Id.
- Fill in the required fields (email, password) and confirm registration.
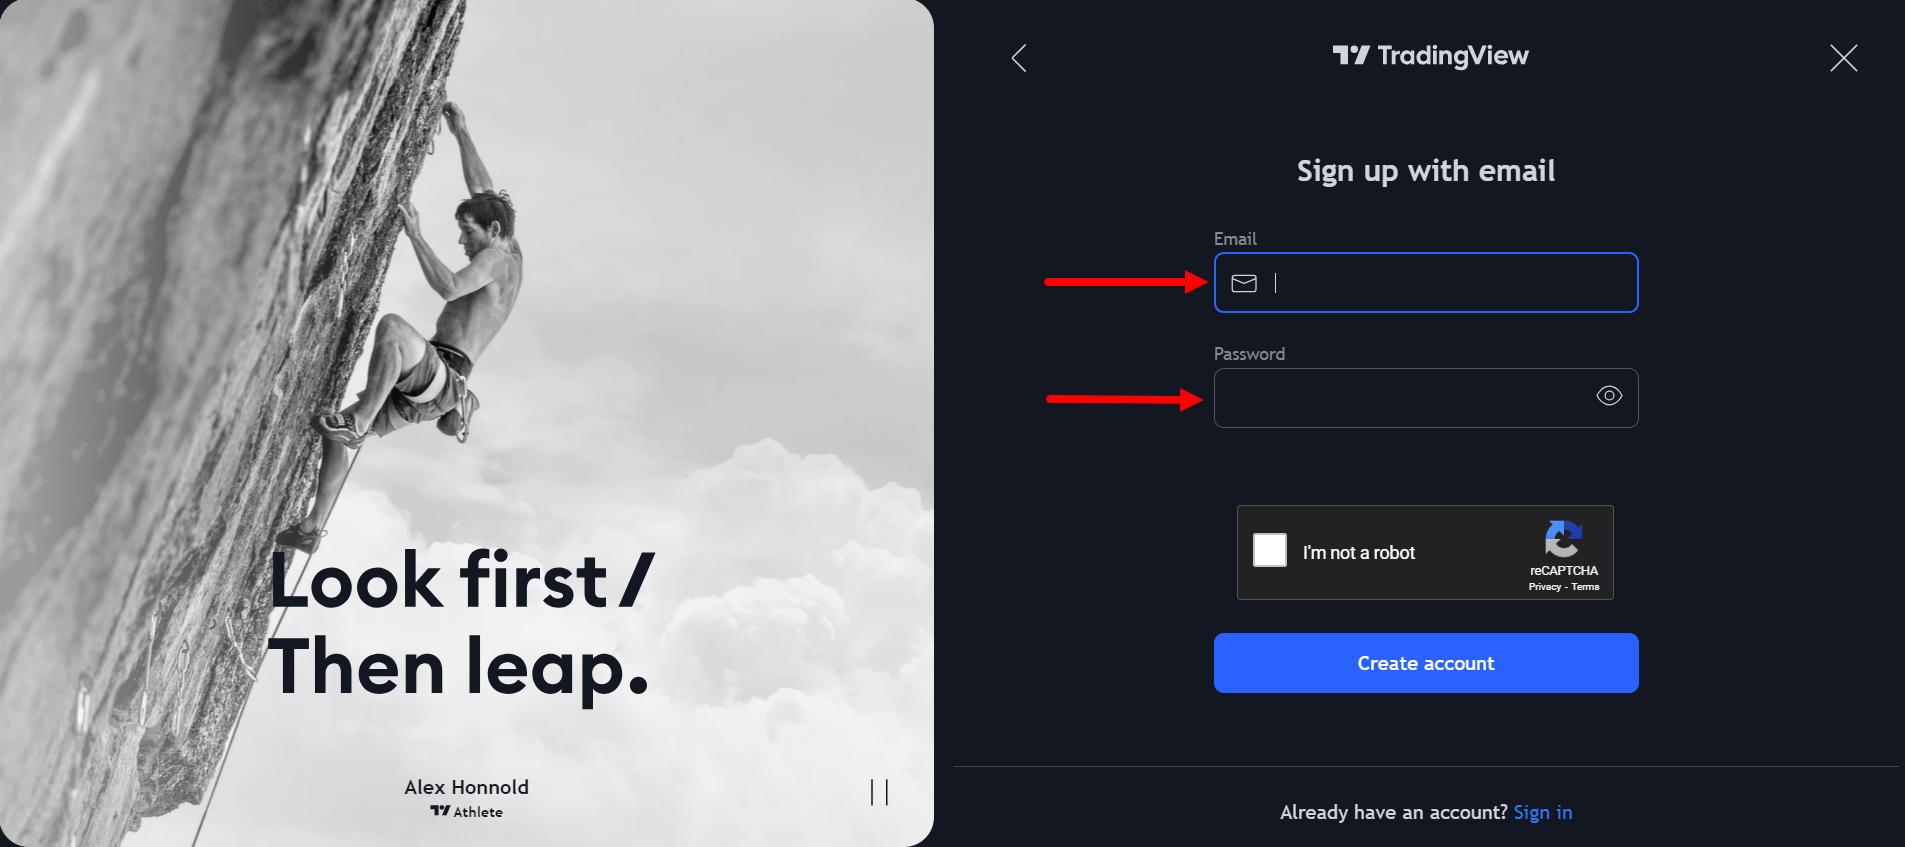
- After registration, you will be asked to take a short introductory tour to help you become familiar with the main features of the platform.
Once you complete registration and login, you can start effectively using TradingView for analysis and trading, even with the free plan.
Section “Markets”
When you register, you will be taken to the “Markets” screen, which provides an overview of the market and the latest ideas from other traders. This screen displays basic information on the selected market. On the TradingView (TW) platform, you can select the following types of markets to review: stocks, ETFs, cryptocurrencies, bonds, forex, indices and futures. You can also choose to review markets around the world or a specific region.
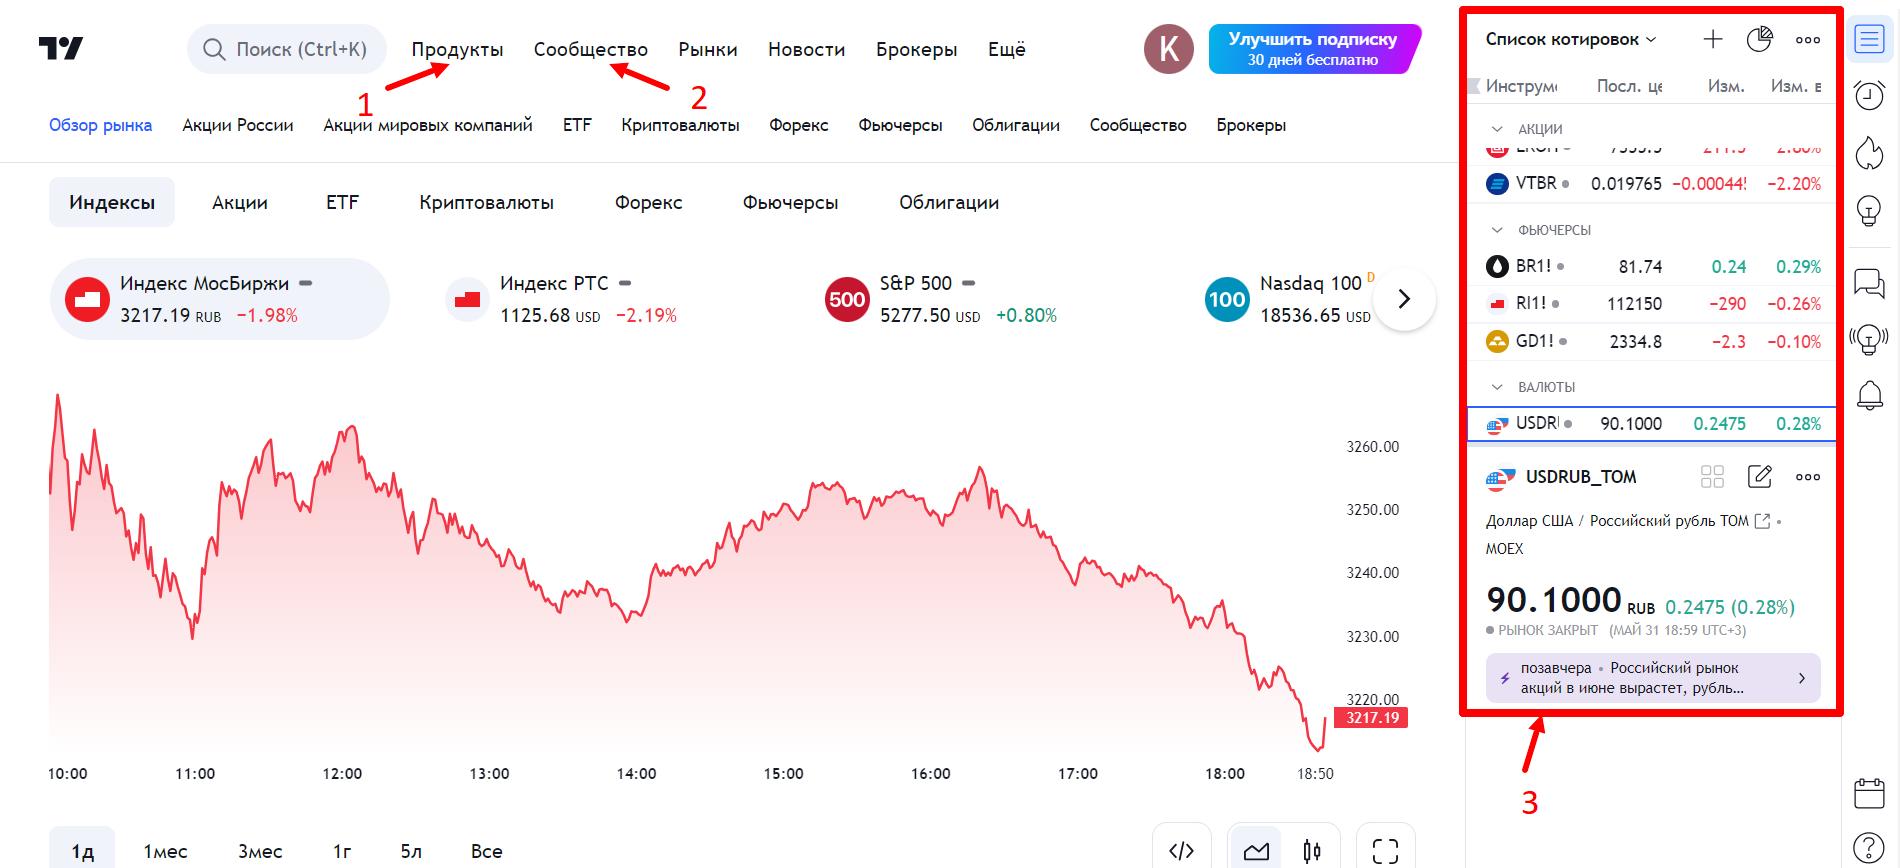
- Products – this section contains the main tools: Supergraphs, screeners, heat maps and economic calendar.
- Community –offers users trading and educational ideas from community members, as well as scripts for trading.
- Quote Screen—This displays the trading pairs you are tracking. Here you can create separate sections and watch lists. The free version has a limit on the number of pairs and lists you can track.
How to open a chart in TradingView
To open a chart in TradingView, you need to use the “Super Chart” section, which is located in the “Products” section. All the tools for working with charts, analyzing and using indicators are collected here. Now let’s take a closer look at the important elements of this home screen.
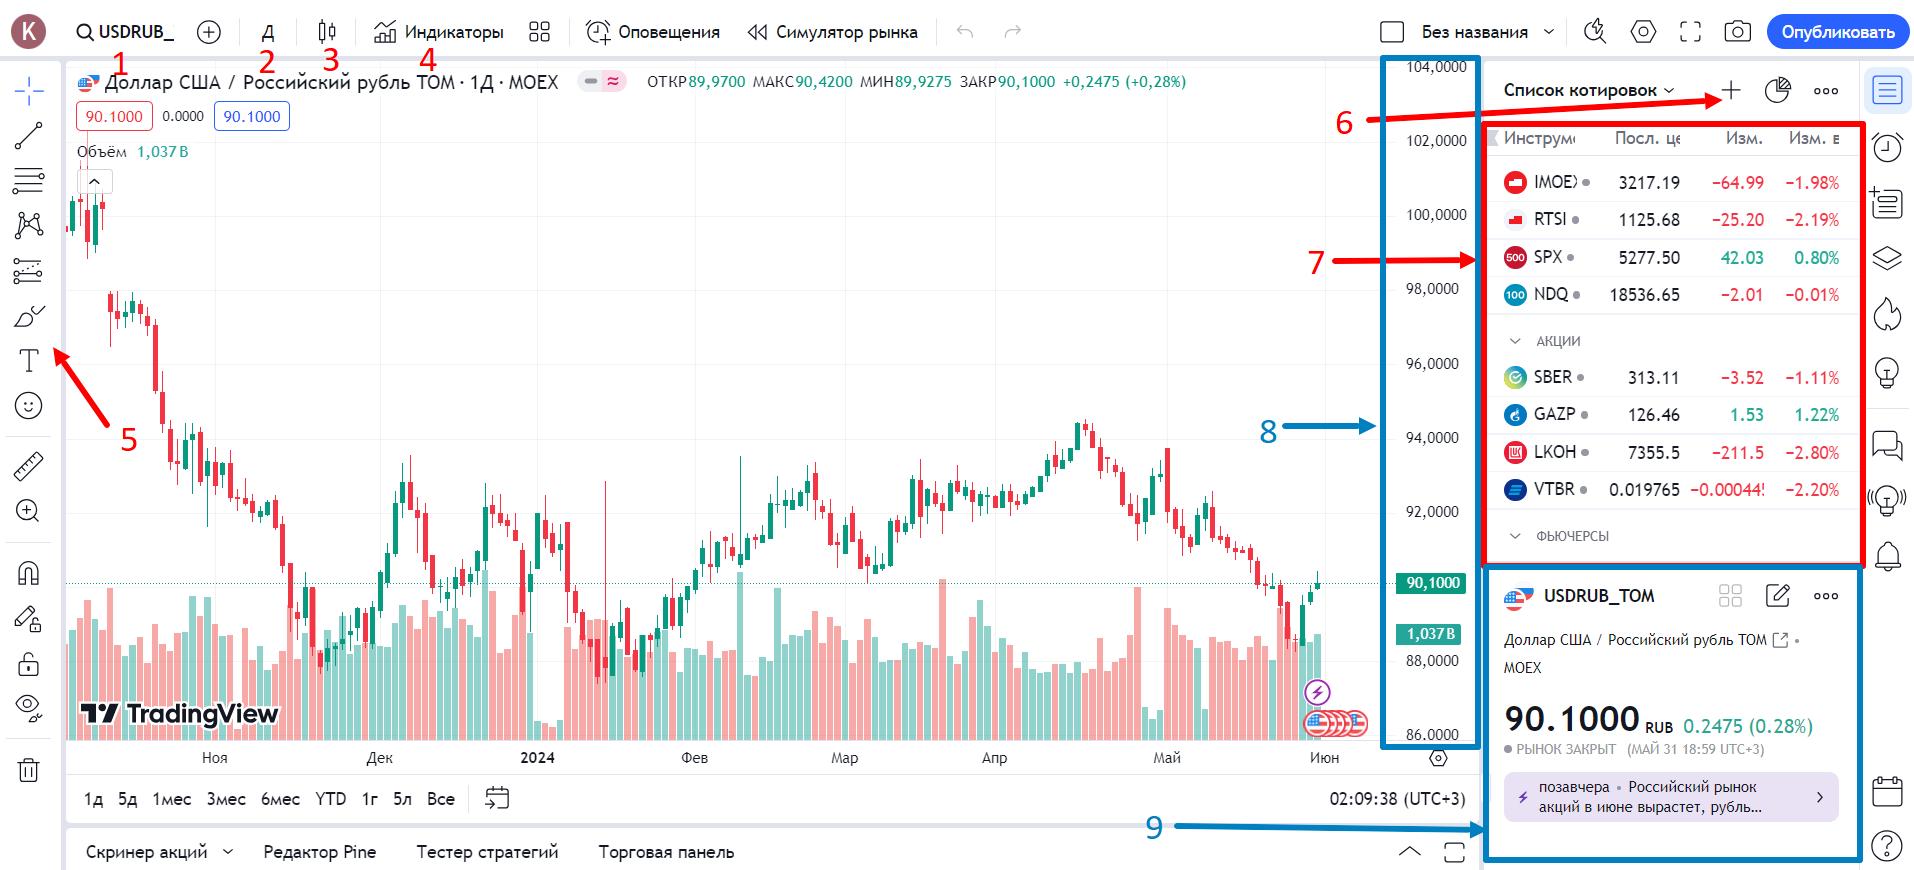
Main elements of the “Supergraph” working screen
- Search and select a ticker

Ticker or name of the trading instrument (USDRUB): The ticker or full name of the company whose chart you are viewing is displayed at the top of the screen. By clicking on the name, you can open a search and select another financial instrument by entering its name, for example Bitcoin or the BTC ticker to search for trading pairs with Bitcoin. - Selecting a time frame

List of timeframes (5M, 10M, 30M, 2H, 4H, D, N, M): Timeframes allow you to select the time interval for displaying the chart. Each timeframe corresponds to one candle on the chart. With the TradinView paid plan, you can add your own timeframes in large quantities. - Chart display types

Candlestick icon allows customize the chart view and types of price movement display, such as Japanese candles, lines, columns, empty candles, bars and other options. - Indicators

Button Indicators provides access to a variety of technical indicators and strategies that can be added to your chart for analysis. To do this, click on the icon and select the desired indicator from the list. - Toolbar

Tools for technical analysis and drawing: lines, patterns, waves and others tools - Plus button

Adding a new trading pair to the watch list for tracking. - List of quotes
List Watches: Displays the assets you are monitoring. You can create multiple watchlists for different types of assets (stocks, cryptocurrencies, etc.). Each item in the watchlist displays a ticker, current price, daily percentage change, premarket price and other information. - Price scale
- A brief summary of the asset: Price, news, technical data. analysis.
- Alerts
Setting up alerts on chart helps you keep track of important price levels. You can create an alert that will be activated when a certain price level is reached or broken. Alerts can be sent to your computer, phone or email. - Action Management

Left and to the right. Buttons for undoing and redoing actions. These features help you easily manage changes to your schedule, allowing you to undo or restore previous actions.
- Search and select a ticker


Status line

- Ticker and exchange
BTCUSDT 1h Binance: displays the chart of which financial instrument is open, timeframe and exchange (in this case, the Binance cryptocurrency exchange). This allows you to quickly determine which market a given instrument is traded on. - Indicators
Down arrow: opens indicators added to the chart. By clicking on this button you will open a drop-down list of all connected indicators, where you can manage them, change settings, delete or disable the display of the indicator on the chart. - Price opening
O (Open): displays at what price the candlestick of this trading pair was opened on the selected timeframe. When you hover your cursor over another candle, you will see its opening (OPEN). - Maximum
H (High): the value shows what the maximum price value of the selected candle was. - Minimum price
L (Low): the minimum price value of the selected candle on the selected timeframe. - Close
C (close): displays the last bar price value. - Trade volume
V (volume): here you will see the trading volume for this pair within the current bar
Other important interface elements

- Square icon
Split screen: allows you to select the number of active graph windows displayed on one screen. This is convenient for analyzing several instruments at the same time, especially on a large monitor.
The function of using multiple charts simultaneously is only available with a paid subscription. - Hexagon
Graph Settings: Access settings where you can change its appearance, add or remove elements, and customize data display, color, and so on. - Blue Publish Button
Publishing Ideas: Allows you to describe your ideas and share them with the TradingView community of traders. This helps you receive feedback and improve your analytical skills.
Additional features and tips from CryptoInside
- Higher timeframes: Always check higher timeframes, even if you work on shorter intervals. This helps to understand general trends and avoid false signals.
- Customize templates: Save and load chart and indicator settings for quick access to your preferred configurations.
- Split screens: Use the split screen feature to analyze multiple charts at once.
- Use watchlists: Add the pairs you trade most often to your quote watchlists. Add sections for more structure. So you can make separate sections for open positions, those that you want to close in the near future, and so on.
The choice of time frame (TF) on which you will trade depends on your trading strategy:
- Intraday (TF 10-30 minutes): for traders trading intraday.
- Medium-term trading (TF 1-4 hours): to hold a position from several days to several weeks.
- Long-term trading, investment (day, week): to hold a position from several weeks to a year or more.
How to set up TradingView: step-by-step instructions
Now that we have examined the main functionality of the platform, we can begin customizing it for ourselves. This will allow you to tailor your schedule to your individual needs, ensuring convenient and efficient trading. Here’s a quick 10-step walkthrough for setting up TradingView:
- Go to the official TradingView website and register if you do not already have an account.
- Log in to your account.
- In the main menu, select the “Products” section.
- In the drop-down list, find and click on “Supergraph.”
- In the search bar, enter the ticker symbol or name of the financial instrument (for example, ETH for the Ethereum cryptocurrency).
- Click on the candlesticks icon in the top panel and select the type of chart that is more convenient for you.
- Select a time interval for trading – timeframe.
- Click on the “Indicators” icon and select the desired indicator from the proposed list.
- Click on the “Gear” icon to access the chart settings.
- Customize chart parameters such as candle colors, lines, grid, etc.
These steps will help you customize TradingView to suit your needs, providing maximum convenience and efficiency when trading, technical analysis and working with charts.
How to add an indicator to TradingView
Adding indicators to TradingView allows you to expand your analysis and more accurately assess market conditions. Here’s a step-by-step guide to adding indicators to the TradingView platform:
- On the top toolbar, click on the “Indicators” icon (columns and broken line).
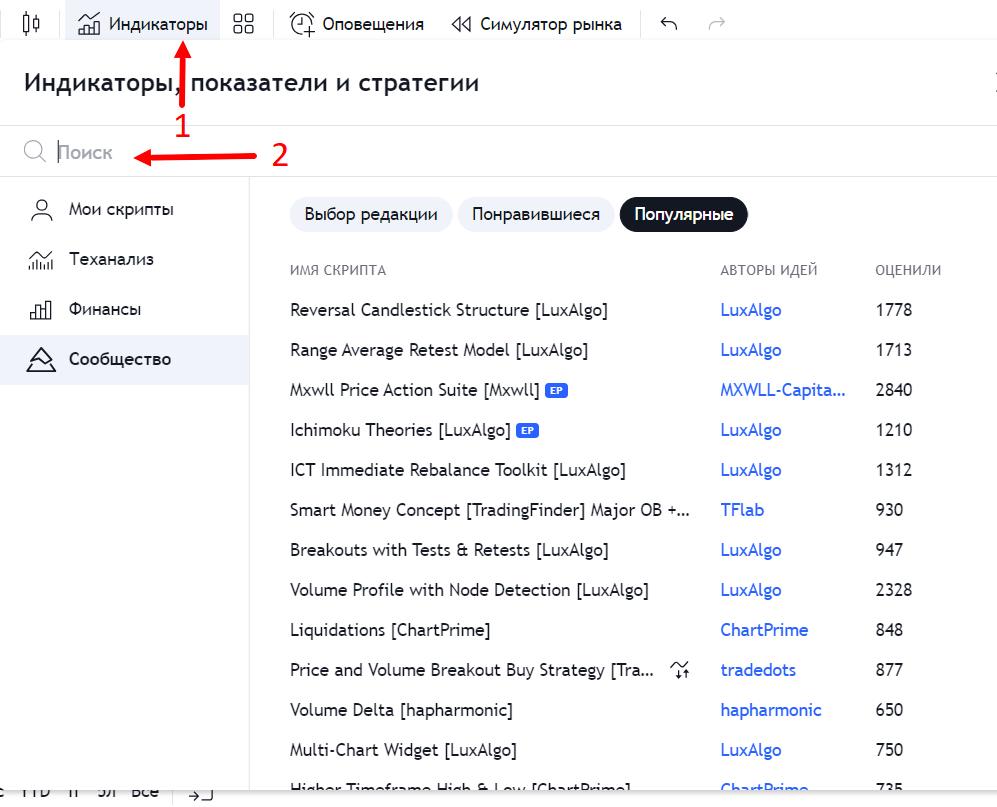
- In the menu that opens, you can use the search bar to find the desired indicator by its name or select from the proposed list. For example, to add a Moving Average, find and click on it.
- To see the parameters and the settings button, click on the down arrow in the left corner under the name of the graphic.
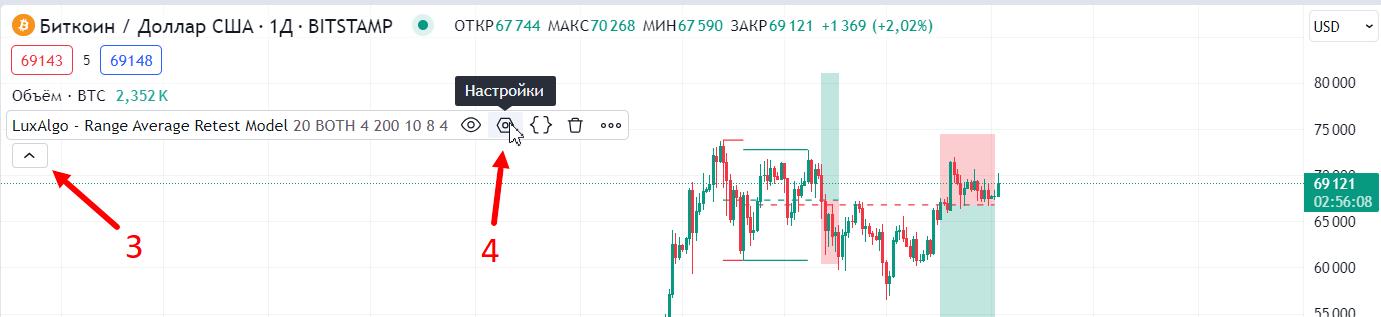
- Click on the hexagon to open the indicator settings window.
How to remove an indicator in TradingView
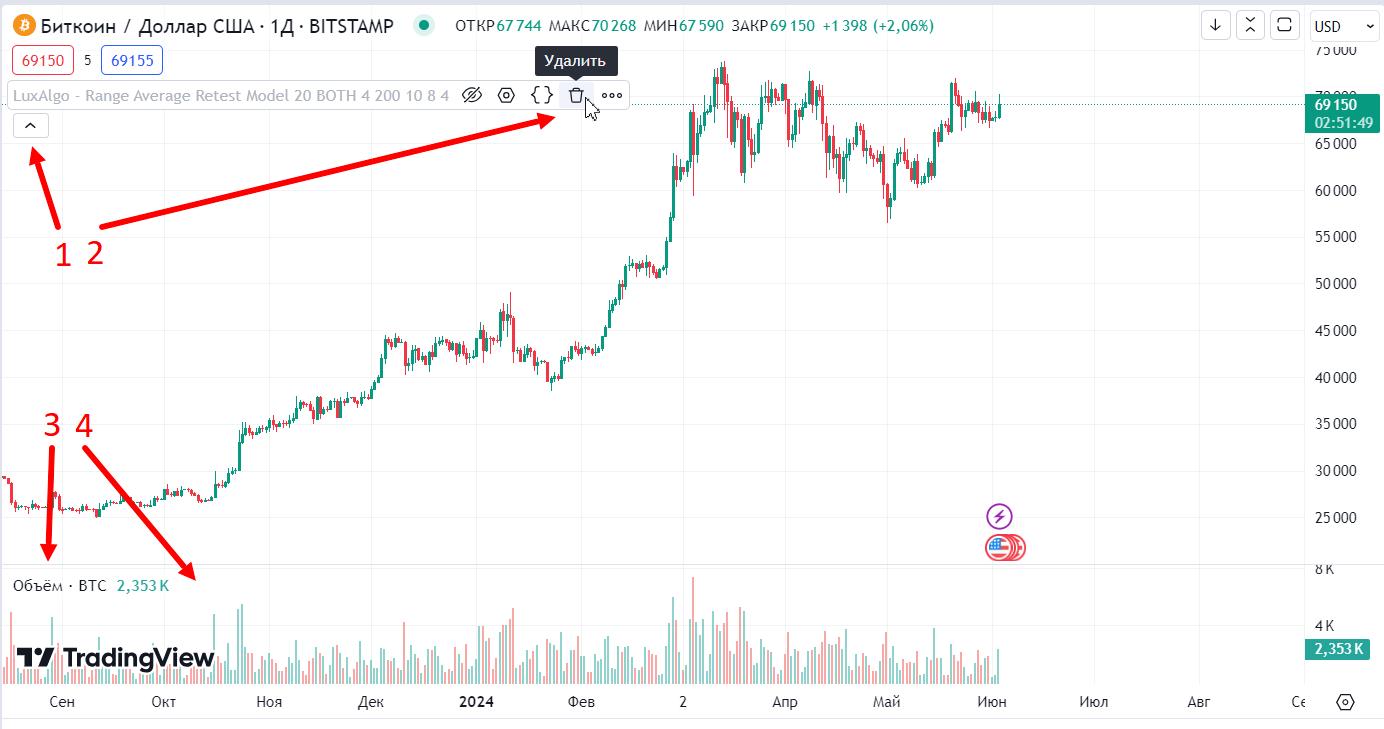
- Click on the down arrow in the left corner or move the mouse cursor over the name of the indicator that you want to delete if it is already pressed.
- Find the “Delete” button and click it to remove the indicator from the chart. After completing these steps, the indicator you selected will be removed from the chart. If desired, you can simply hide the indicator display by clicking the crossed out eye button.
- In TradinView, indicators can be located in separate panels on the chart. If you want to remove an indicator from a separate panel, hover over the indicator name in that panel and action buttons will appear.
- Click on the trash can button to delete the indicator and its panel.
How to open 2 or more charts
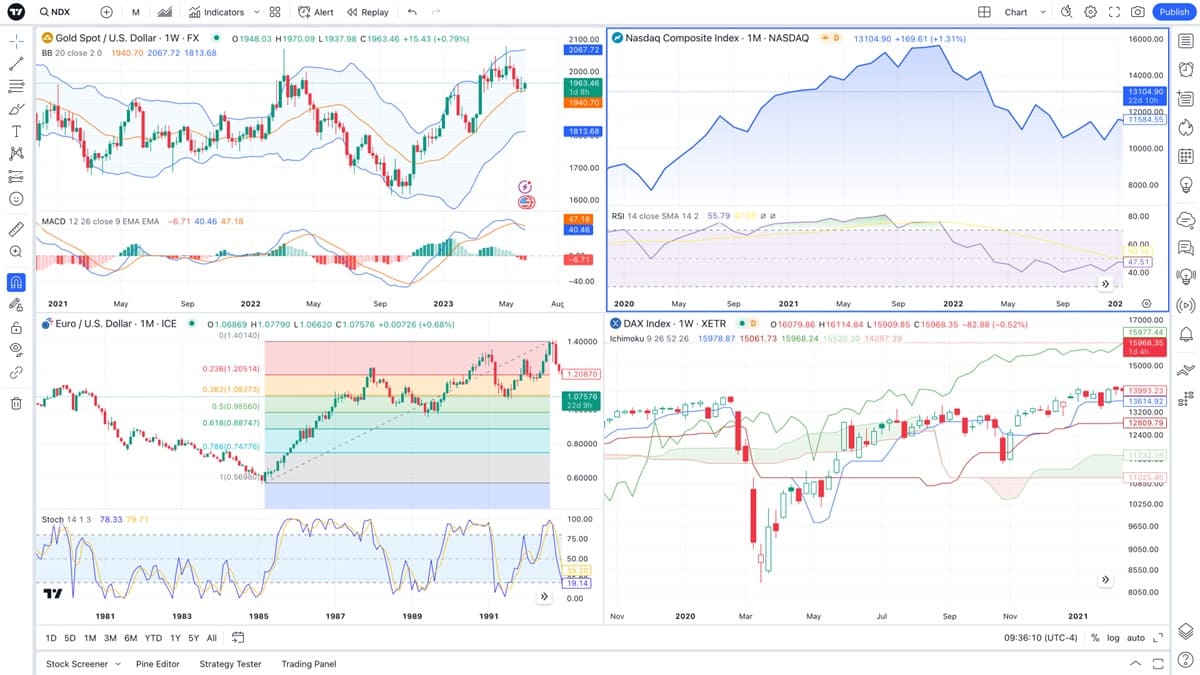
Opening multiple charts in TradingView is quite easy. On the top panel, click on the “Square” button located in the upper right corner of the screen and select the required number of graphs. This feature requires an active paid subscription. Then click on the “Add New Chart” button (usually a plus sign or a “blank” chart).
Repeat this process for each chart you want to open.
How to use Fibonacci in TradinView
In technical analysis, traders often turn to the Fibonacci grid to find optimal entry points into the market. This method is based on the ideas of the fractal nature of price movements and is supported by the legacy of the great mathematician Leonardo Fibonacci.
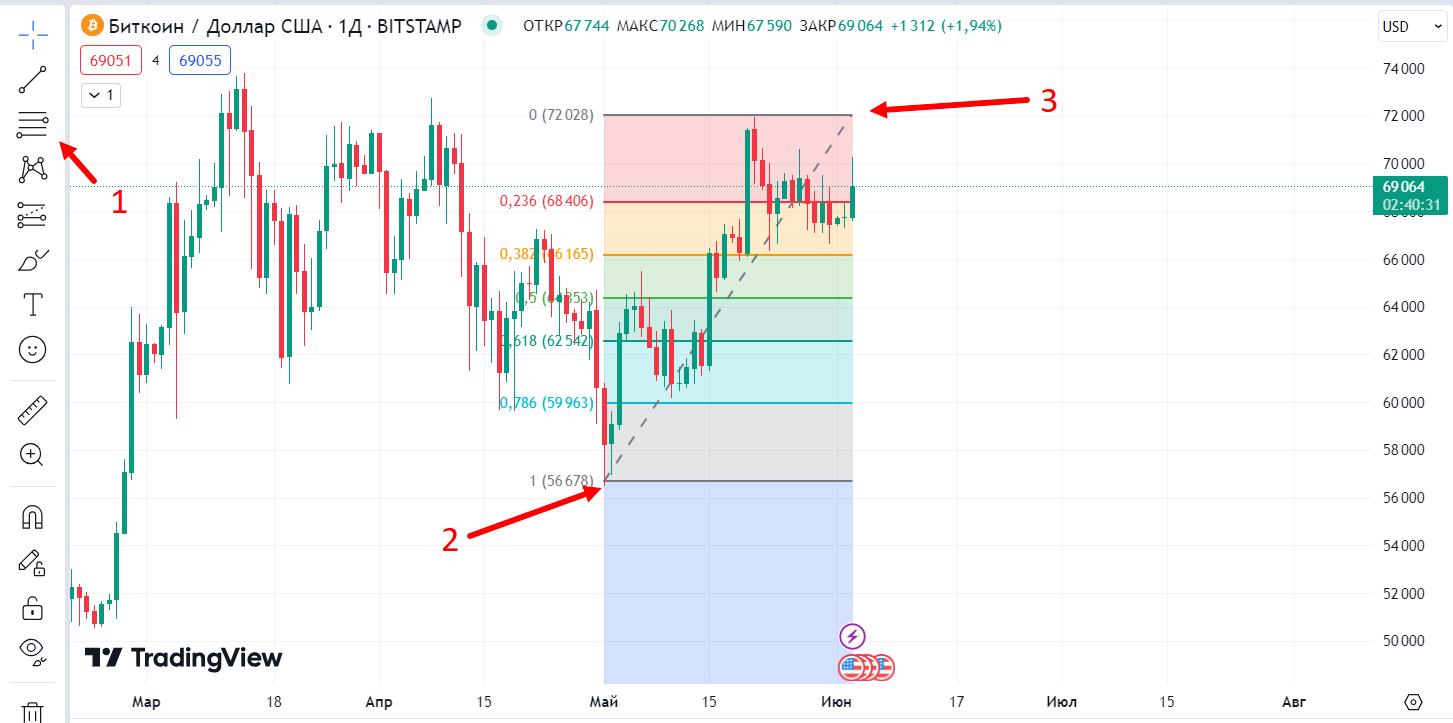
Using the Fibonacci grid in TradingView can be useful in analyzing price levels and predicting price movements in the market. Here’s how it’s done:
- Opening the Fibonacci tool:
- Find the Fibonacci tool in the toolbar on the left, it is shown as a grid.
- Click on this tool to activate its use.
- Selection of points for Fibonacci plotting:
- Select a point on the chart from which you want to start building the Fibonacci grid. This could be a minimum or maximum point that you are interested in analyzing. If the trend is bullish and the price is moving up, then the first point will be at the low of this movement.
- Hold down the left mouse button and drag the cursor to another point on the chart to which you want to build a Fibonacci grid. This is usually the extreme point, but any other point can be chosen. If the price moved up, then this point will be at the top, at the last price high.
- Displaying Fibonacci levels:
- After selecting two points, release the left mouse button. TradingView will automatically display Fibonacci levels between these two points.
- Typically the Fibonacci grid will contain levels of 23.6%, 38.2%, 50%, 61.8% and 100%. They are used to identify potential support and resistance levels. A strong level is considered to be 61.8%.
- Configuration and analysis:
- You can customize the style and color of Fibonacci levels to suit your preferences.
- Once the Fibonacci grid has been constructed, you can use it to determine support and resistance levels and place buy or sell orders at those levels.
How to trade on TradingView
TradingView integrates with multiple brokers, allowing you to trade directly through the platform. To do this, you need to select a broker in the “Brokers” section and follow the instructions to connect a trading account. After connecting your trading account to the exchange, you can set up a trading terminal. In this section you can select assets for trading, set parameters for orders and position monitoring.
How to pay for TradingView from Russia
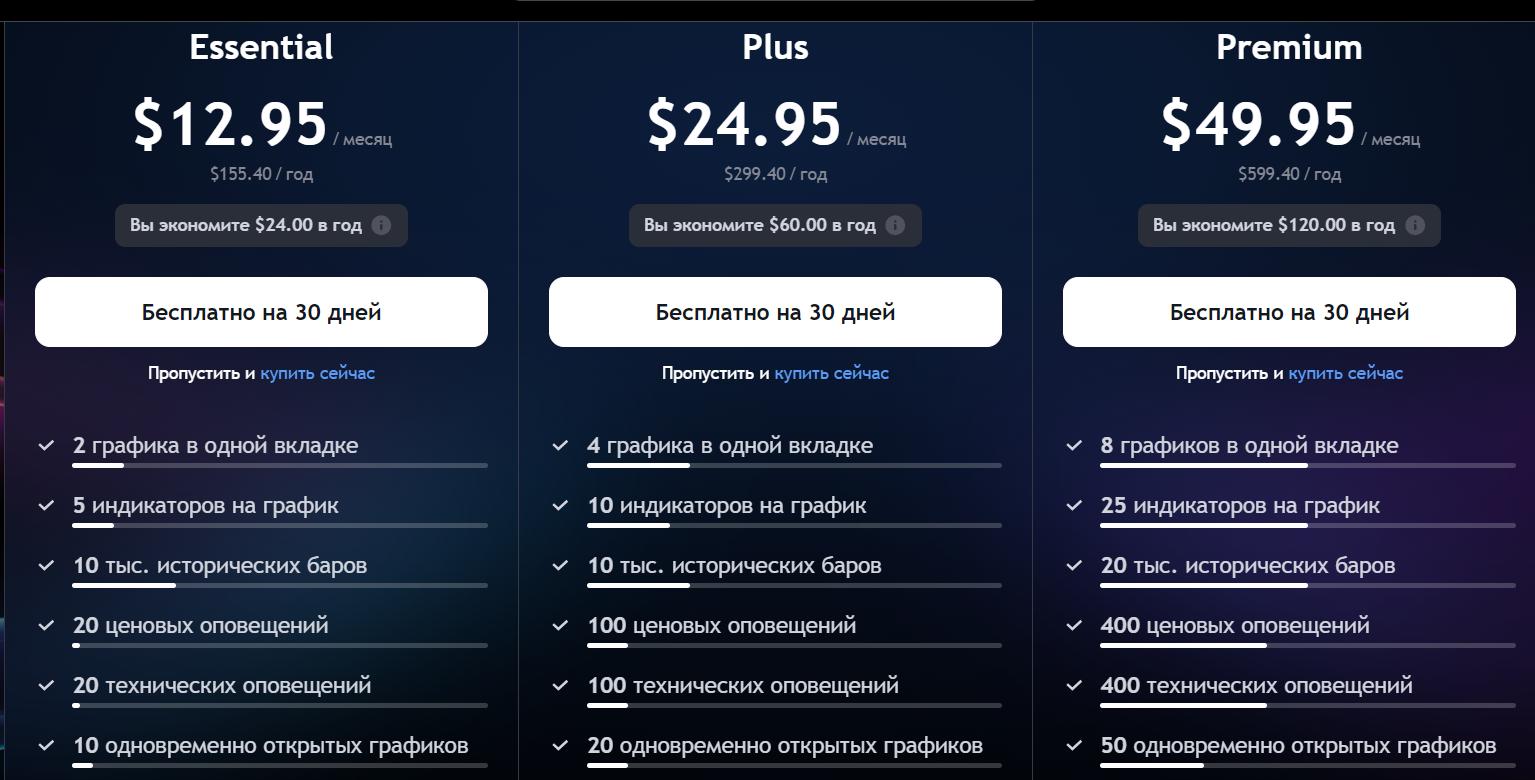
Payment for a TradingView subscription can be made in several ways: bank cards, PayPal and cryptocurrencies. However, for Russian citizens, subscription payment is available only through cryptocurrencies.
The option to pay with cryptocurrency is available only when paying for a subscription for a year at once. But you get a discount and in the end the subscription will be cheaper for you than if you paid every month.
You can pay directly from your exchange where you have funds. The cost of the basic paid plan for the year is $155 US dollars, which is equal to $12.95/month.
Discount for TradingView subscription
For CryptoInside readers, in the Services section of the platform card there is a $15 discount on a TradingView subscription. Go to the services section and find out the details of receiving the bonus.
Conclusion
TradingView is a powerful tool for traders, analysts and investors, providing a wide range of analysis and trading capabilities. With its help, you can effectively conduct technical analysis, develop and test trading strategies, as well as maintain your blog and interact with the trading community.
No matter your level of experience, TradingView can be an indispensable assistant in your trading activities.
Share your opinion about the platform and leave comments, subscribe to our Telegram channel so as not to miss interesting news and articles.

Crypto market analyst with seven years of experience in blockchain technologies and digital asset investing. Active in the cryptocurrency space since 2017, having navigated multiple bull runs and bear market cycles. Specializes in blockchain project analysis, crypto exchanges, DeFi, and investment strategies. Dedicated to helping readers navigate and understand the digital asset economy.
- Andrey Sokolov

- Andrey Sokolov